June 7th, 2025
10 Best Data Analysis Software Applications to Try in 2025
By Connor Martin · 6 min read
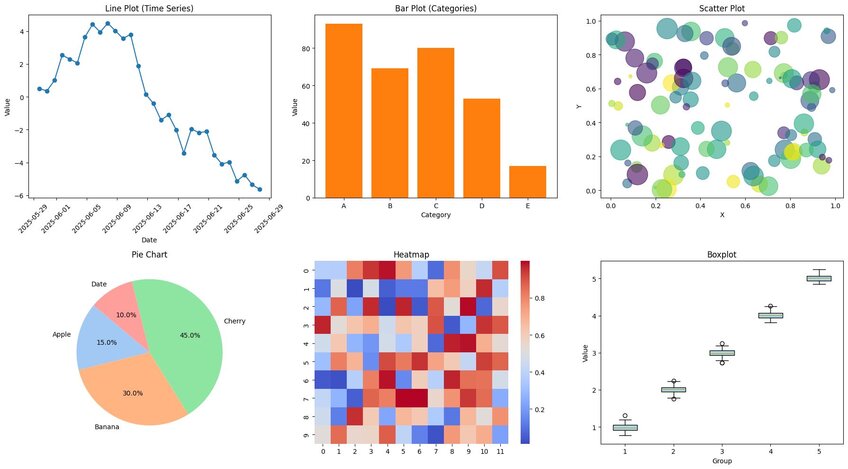
From healthcare to finance, data plays an important role in numerous industries. Many modern businesses collect and utilize ever-larger sets of data to make their decisions and inform their strategies.
However, on its own, data doesn’t necessarily tell us much. It’s only by analyzing it, looking for trends, and deriving valuable insights that we extract value from all those numbers and statistics.
That’s where data analysis software comes in. Statistical analysis software carries out complex data analysis processes, like cleaning up and sorting raw data or generating data visualization, to help users learn from and harness the data they gather. There are many data analysis tools to choose from, and this guide looks at 10 of the best.
Key Takeaways
• Data analysis software helps organizations turn complex data into actionable insights, streamlining tasks like cleaning, visualizing, and interpreting information across various industries.
• Modern data analysis tools are becoming more accessible, with many platforms now offering no-code interfaces, AI-driven features, and seamless integration for users of all skill levels.
• Choosing the right tool depends on your team’s experience, goals, and data complexity, with top options ranging from code-heavy environments like Python and RStudio to no-code or AI-powered solutions like Tableau, Zoho Analytics, and Julius AI.
The Rise (and Importance) of Data Analysis Software
Data has always been an important component of many industries, from business to research. Similarly, it has always been beneficial to analyze data to spot trends and patterns, and then use that information to inform future decisions and strategies.
There was a time when it was reasonable to analyze data manually, but with the amount of data being collected growing exponentially, processes of data management and data analytics have become more difficult, or even impossible, for human workers.
Data analysis software solves that problem. Programs can carry out complicated analytical tasks, like predictive analysis and working with vast data sets, faster and more efficiently than teams of data analysts ever could.
This makes it possible for us to learn from data, to derive insights from it, to spot patterns, identify trends, and see the meaning behind the numbers. Organizations can then use what they learn in numerous ways, making more data-driven decisions in fields like healthcare, education, retail, finance, manufacturing, engineering, and far beyond.
Additionally, as the need for these programs rises, the software itself becomes more advanced and capable. Many of the earliest examples of statistical analysis programs were quite rudimentary in their focus and functionality, but modern data analytics tools feature advancements like AI capabilities that empower organizations to get more from the data they collect.
What Makes a Great Data Analysis Software?
The best software should naturally aim to facilitate and support multiple aspects of the data analysis process, giving users the power they need to dig deep into their data. In addition, leading apps should also excel in the following key areas:
• Ease-of-Use: More often than not, it’s helpful to have software that is easy to work with. Many organizations and individuals working with data may not have extensive data science backgrounds or advanced coding skills, so they need applications that take much of the complexity out of the data journey.
• Key Features: The best business analytics solutions should, at least, be able to offer customizable reporting, a range of analytical processes, integration with other applications and systems, scalability to support large and small sets of data, and the capacity to visualize data in forms like charts and graphs.
• Fair Pricing: Price-wise, too, data analysis software varies. Some programs are actually free to work with, or at least have limited free plans or trials. Others come with hefty license fees or subscription plans. Depending on your budget and needs, it is important to find a solution that aligns with your data needs without going over budget.
What Are the 10 Best Data Analysis Software Applications Today?
Without further ado, here’s a look at 10 of the best examples of data analysis software to use for all your data manipulation needs:
1. Julius AI
2. Python
3. RStudio
4. Tableau
5. SAS
6. SPSS
7. Alteryx
8. Apache Spark
9. Jupyter Notebooks
10. Zoho Analytics

#1 - Julius AI
AI is becoming an increasingly key part of the data analysis world, and Julius AI currently stands out as the leading AI data analyst. Intelligent, precise, and rapid, this AI-powered solution can assist with any data-related task, from qualitative data mining to predictive analytics and visual generation.
The best part is it’s so simple to use. You just input your data and let the AI do all the hard work in seconds.
#2 - Python
Python is a programming language that has an accessible learning curve compared to others. It is known for its excellent suitability for data analysis, helping to break down data sets and find trends in statistics and figures.
It has various built-in analytical tools to assist users and is particularly effective when it comes to generating visuals, like charts and graphs, to present data insights to broad audiences.

#3 - RStudio
RStudio is an open-source development environment for use with the R programming language, which was designed with stats analysis in mind.
Users need to have a certain level of coding ability to make the most of R, and it has something of a steep learning curve. But if you can master it, few data analysis tools can match this one in terms of its versatility and vast array of features.
#4 - Tableau
Tableau is an example of a no-code data analysis program, which means you don’t need to be able to write and execute code to use it. It is therefore an accessible option for users with varying experience levels and backgrounds.
It is especially valued by business users. It can help you dig into sales and marketing data, or financial forecasts, to make smarter decisions for growth and success.
#5 - SAS
One of the longest-running examples of data analysis software, SAS, or Statistical Analysis System, started back in 1972. Now, more than 50 years later, it’s still going strong, which shows how reliable, stable, and consistent it is for tasks like data management, business intelligence, predictive analysis, and advanced-tier data analysis.
#6 - SPSS
Another staple of the stats analysis world, SPSS (Statistical Package for the Social Sciences), also known as IBM SPSS, was released in the late 1960s.
It has been significantly improved and upgraded over time with new features and is favored by many for its intuitive, customizable interface and capacity for creating data visualizations in various forms, from simple bar charts to more complex alternatives.
#7 - Alteryx
Alteryx is more of a modern solution than the likes of SPSS and SAS. It is an AI-focused analytics automation platform, helping organizations with analyzing, transforming, and preparing data for the AI age.
It has particular relevance for fields like finance, retail, manufacturing, and insurance, and has proven a valuable option for firms seeking to elevate their analytics capacities.
#8 - Apache Spark
Apache Spark is an open-source analytics engine, primarily aimed at processing and extracting insights from very large sets of data.
It supports batch data processing in a range of popular statistical analysis languages, including Python and R, and allows users to perform exploratory data analysis on extremely large scales. As such, big enterprises should definitely consider this tool.

#9 - Jupyter Notebooks
Jupyter Notebooks is a web-based analytics environment where users can create and share notebooks, write and run analytical code, clean and sort their data, make visualizations, and so on. You can also combine different lines of code, reports, and visuals in a single, shared space, which is great for collaboration or stakeholder engagement.

#10 - Zoho Analytics
Zoho Analytics delivers robust, detailed insights from data sets of varying sizes and is popular for its flexibility. You can import data from various sources to this platform, including many commonly used business apps and databases, then use Zoho features to clean and analyze your data. It even has dedicated mobile apps for data analysis on the go.
How to Choose the Right Tool for You and Your Team
As you can see, there are several solutions to choose from, all with their key features, helpful functions, and best-use cases. So, choosing the right data analytics tools for different needs and situations can be tricky, but it’s important to make the right call if you want to make the most of your data analysis.
Here are some best practices and helpful tips to assist:
• Consider Your Team’s Experience and Ability Levels: The last thing you want is to invest in a data analysis tool that your team struggles to use or can barely understand. If you have a team of non-technical users, for example, focus on data analysis software that is intuitive, with user-friendly features like AI-powered analysis and drag-and-drop interfaces.
• Always Keep Your End Goals in Mind: Set objectives for your data analysis. What do you want to gain from it? Answers will vary from organization to organization and industry to industry. Some will want to use data to track marketing campaign performance, while others might use it for research and development. Find the tools with the features that help you achieve your objectives.
• Think About Capacity and Compatibility: The data analysis tool you use needs to be capable of working with whatever data you wish to analyze. The more data you have, and the more complex it is, the harder it can be. Make sure your chosen software can handle your data sets and look for tools that are compatible with other elements of your tech stack.
What Does the Future of Data Analysis Software Look Like?
In just the past few decades, data analysis software has come a long way. The earliest tools were relatively primitive compared to those of today, and many were once incredibly complicated to work with, demanding professional-level coding skills and data science expertise. Now, many tools are exceptionally intuitive and capable of far more than those that came before.
In the years to come, we can expect this trend to continue, with data analysis software of the future set to be increasingly effective, accessible, and powerful. Future software will likely lean more on the power of emerging technology, like AI and machine learning, to deliver precise business intelligence and insights, craft more detailed visuals, and unlock new ways of using and exploring data sets.
Stay Ahead with Julius AI. Try It for Free Today, and Discover How Simple Data Analysis Can Be
As this guide has shown, there are plenty of terrific data analysis software solutions out there that can help you dig into data and learn from it. They vary in features, functions, and complexity, and some may feel a bit daunting or somewhat limited in certain areas.
If you’re looking for a comprehensive tool that can do almost any data-related task, yet isn’t confusing to work with for non-technical users, look no further than Julius AI. It can quickly become your go-to tool for all data analysis, with the AI doing much of the work, so you don’t have to. Test it out today, free.
Frequently Asked Questions (FAQs)
Is data analysis easy?
Data analysis can seem intimidating at first, especially when dealing with large data sets or technical tools. But with the right software—especially no-code or AI-powered platforms—the process becomes much more approachable, even for those without a background in data science.
What exactly is data analysis software?
Data analysis software is a tool that helps users clean, organize, interpret, and visualize data to uncover patterns and insights. These tools range from code-heavy platforms to intuitive, no-code solutions designed for ease of use and fast results.
What is the best software for data analytics?
The “best” tool depends on your specific needs, experience level, and goals. That said, Julius AI stands out for its powerful AI-driven analysis and user-friendly design, while other popular tools include Tableau, Python, and SPSS.
What is the most common tool used for data analysis?
Tools like Excel and Python are among the most commonly used due to their flexibility and broad functionality. Tableau and SPSS are also widely adopted for their strong visualization and statistical analysis features, while newer platforms like Julius AI are quickly gaining popularity for combining powerful analysis with ease of use.
