November 23rd, 2024
6 SPSS Tips & Best Practices
By Jaden Moore · 6 min read

IBM SPSS Statistics, otherwise known simply as SPSS, is a go-to tool among data scientists and analysts the world over. It’s not hard to see why, as SPSS offers an array of advantages over other data management solutions.
It’s user-friendly and immensely versatile, recognizing numerous variables and offering many different functions. But, in order to make the most of this program, it’s important to know a few helpful SPSS tips, tricks, and best practices, which this guide will explore.
Understanding SPSS
Before we dig into our list of SPSS tips and techniques, let’s first take a moment to explain what SPSS is and how it’s used, as you might not yet be fully familiar with this tool.
SPSS is actually the name of a whole family of software programs, originally designed by SPSS Inc., but later taken over by tech giant IBM. SPSS is used for the likes of statistics and data analysis, and it’s especially popular with social scientists, data scientists, market researchers, and those in related fields.
SPSS has long been lauded as a game-changing tool for stats analysis, thanks to its intuitive nature. Its versatility is another selling point, as it can handle data documentation and data management, in addition to statistical analysis.
6 Best Practices & Tips for Getting the Most Out of SPSS
Here’s how to get the most out of your time with SPSS:
1. Working with Variable Properties
2. Using the Data Editor
3. Cleaning Your Data
4. Saving Output Files
5. Learn SPSS Syntax
6. Use the Chart Builder
Working with Variable Properties
First, when you’re working with a lot of different variables, it’s helpful to keep their names as simple as possible. That way, it’ll be easier for you to tell new variables apart and understand, at a glance, what each one does.
Next, you should also copy and paste different variable properties between variables to save time. You can access the SPSS Codebook at any point to see a full list of all variables and their properties.
Using the Data Editor
When you’re using SPSS Data Editor, the “Merge File” feature is a huge time saver. However, it often results in error messages and other issues if you try to merge datasets that aren’t compatible.
So, before merging, always take the time to verify your data. Check to see that the format of all named variables is consistent across the two files, and fix any discrepancies you notice. Try using the “Copy Data Definitions” feature, too, as that’ll check for and fix errors for you, automatically.
Cleaning Your Data
This is a good rule for data analysis in general, but it’s especially relevant when working with IBM SPSS: clean your data before you start to work with it.
You can do this either manually or automatically, with the aid of data-cleaning tools or scripts. Either way, it helps to get rid of duplicates and discrepancies and lets you condense your data as much as you can before you input it into SPSS, as that’ll make it much easier to work with.
Saving Output Files
By default, most SBSS files are saved in the .sav format. However, that’s not the only output file type you can produce when you use SBSS.
You’re also able to export your files or even individual assets, like tables and charts, into formats like PDF and HTML, as well as other file types that work in MS Office solutions like Word and Excel. This is worth doing, especially if you plan on sharing your files with other people who may not use SBSS.
Learn SPSS Syntax
There are basically two ways to work with SPSS: you can either use its built-in menus and buttons to activate features and functions, or you can essentially code them yourself using SPSS syntax.
At first, users tend to stick with the menus. But over time, you’ll want to learn and utilize SPSS syntax as much as you can, as there are some more complex, advanced functions you can only use this way. Use online guides and tutorials, as well as regular practice, to improve your SPSS syntax knowledge.
Bonus Tip: Remember to save pieces of variable information and complicated recording procedures in syntax file format, so you can reuse them later.
Use the Chart Builder
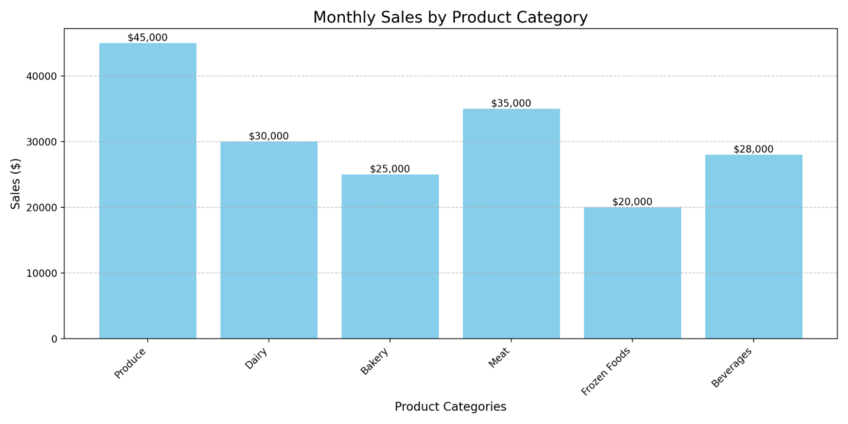
One of the best things about SPSS is its Chart Builder feature. This is exactly what it sounds like – a tool that can build charts, like bar charts, from your data.
It’s really useful for data visualization if you intend to present your data to others or want to condense a lot of stats and figures into easily digestible charts and table format. So, don’t overlook this tool. Use it often to improve your chart creation skills.
Pros and Cons of SPSS
Pros
The advantages of choosing SPSS for stats analysis and data management include:
- Intuitive: As touched on earlier, SBSS is one of the most intuitive data analysis solutions. It allows almost anyone to analyze stats and data, without unnecessary complications.
- Versatile: SPSS’ many features and functions make it a versatile, flexible tool for working with data in different ways. It can spot trends, produce visualizations, and much more.
- Precise: As long as you follow best practices and use clean, organized data, SBSS will deliver flawless results and analysis. It’s a remarkably precise and reliable analytical solution.
Cons
SPSS does have some downsides, such as:
- Expensive: Price is a definite downside with SBSS. It can cost thousands of dollars to use this software, putting it out of reach for many.
- Syntax Learning Curve: As explained earlier, it’s vital to learn SPSS syntax to make the most of this software, but that can be quite tricky for many users.
- Can Be Sluggish: Sometimes, when dealing with vast data sets and complex equations, SBSS can feel a little laggy or slow.

Enhance Your Statistical Analysis Beyond SPSS by Using Julius AI
While SPSS is clearly one of the top tools for data analysis, it’s not the only one. Nor is it perfect. As such, it’s worth broadening your horizons and including some additional tools in your analytical arsenal, like Julius AI.
Julius AI is an AI-powered data analysis solution, capable of carrying out complicated analytical processes through simple user prompts. Fast, efficient, and astonishingly intuitive, it’s a game-changing tool for data scientists, students, and analysts everywhere.
